Collect and process OTM data
collect_otm_data.RmdOverview
In this vignette our goal is to present the co-first step of the
workflow presented in the throne package, the collection of
operative temperature model (OTM)
data.To collect this data we will need to 1) build, 2) program, 3)
deploy and 4) read the measurements collected by the OTM. Here, we will
provide some general guidelines on how to perform each of these steps
such that they integrate adequately with the software developed for the
throne package. In the context of the whole package’s
workflow, we highlight the areas covered in this vignette below:
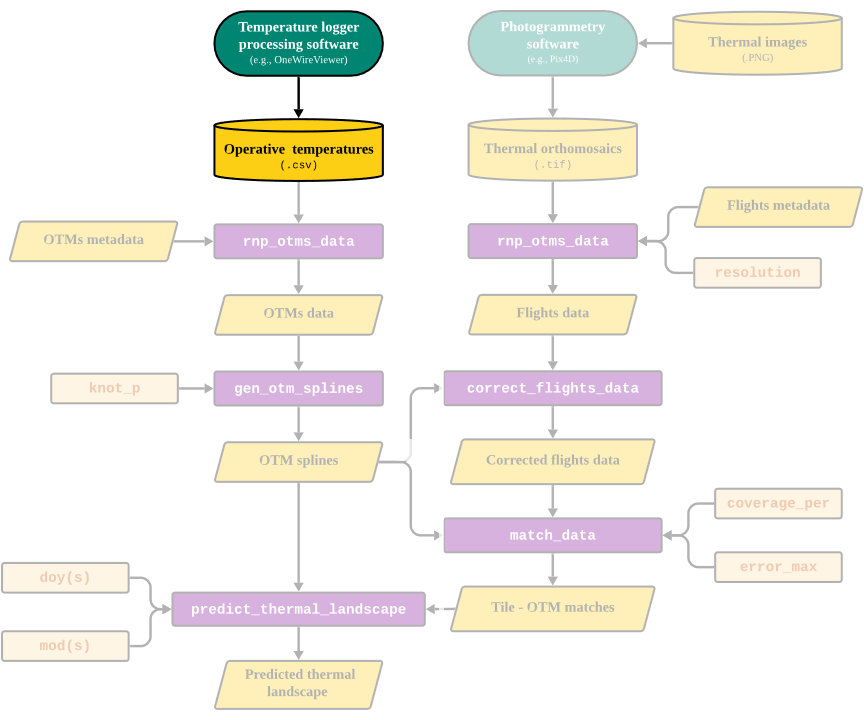
Part of the workflow covered in this vignette
Building OTMs
Typically, an OTM is the sum of two components; a body and a temperature logger which is contained inside of the body. The physical properties of the body of the OTM will determine its internal temperature which in turn will be captured by the temperature logger. The goal when building an OTM’s body is that it matches the biophysical properties of the organism of interest as accurately as possible such that the temperature measured by the logger closely matches that which the organism would experience if it were on the exact spot where that OTM is deployed. This is the concept of operative temperature. To that end, it is recommended that the body is of a similar volume, mass and color of the organism of interest to ensure that properties such conduction and convection and radiative heat transfer are comparable. Many techniques have been employed over the years to achieve a body of such characteristics. For instance, among studies of terrestrial ectotherms (for which OTMs are commonly used), copper pipes were historically considered to be an accurate analog to many organisms. However, as part of a separate study, we showed that 3D printing can surpass the performance of copper pipes at a fraction of the cost. We strongly recommend 3D printing to build OTM bodies as we detail in Alujević et al. 2024. As an example, below is a picture of the OTM bodies we used for this study:
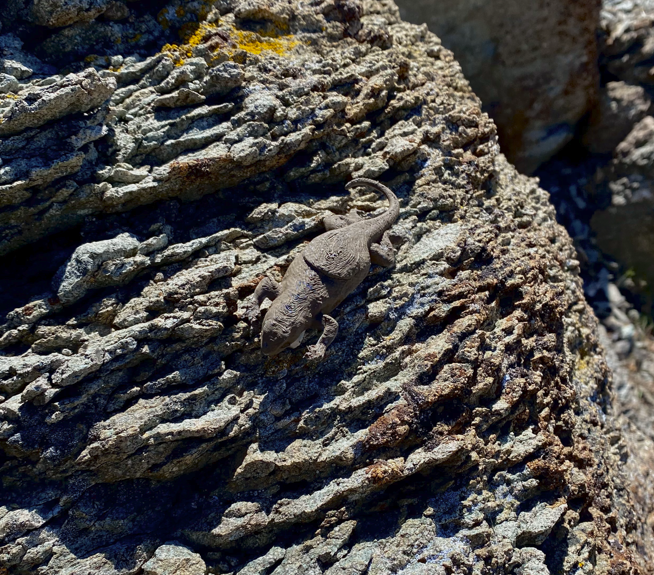
An operative temperature model (OTM) used for this study
The second component of an OTM is the temperature logger. We recommend using iButton temperature loggers. For this study, we used the thermocron DS1921G-F5# from Embedded data systems at ~ 50 US Dollars / unit (down to 40 US Dollar / unit if they are ordered in bulk). Other models are available at similar prices so we leave it up to the user to make their own choice. Nonetheless, when choosing a temperature logger model we recommend considering:
- That the temperature logger has a temperature range that encompasses of the typical range of temperatures that occur in the area of interest.
- That it has as high recording accuracy. For example, a logger that can record temperature changes at 0.1 C intervals would be more accurate than one that can only record temperature changes at 1 C intervals.
- That it has a a thermal resolution that is relevant for the study. For example, an iButton that can only record temperature changes at 10 C intervals would not be optimal when studying micro climatic variation in the order of a few C, but an temperature logger with a resolution of of 0.5 - 1 C might suffice.
- That the temperature logger can store a number of readings at a frequency that is adequate for the study. Ideally OTMs will be deployed in the field for longer periods of time so the user will need to consider the trade-off between a logging frequency that is relevant to capture the thermal fluctuations of the environment and the number of readings the logger can store at that logging frequency.
Programming temperature loggers
Before the OTM is deployed in the field, the temperature logger it
contains must be programmed. Programming temperature loggers might be
specific to logger brand and model. In our case, program an iButton 3
things are needed, 1) a reader to be able to read and
transfer data to and from the iButton, 2) an adapter
that can transmit information from the reader to a computer and 3) a
processing software from which instructions and data
can be inputed and retrieved. For each of these purposes we used the DS1402D-DR8 +
iButton Reader and the DS9490B# USB 1-Wire
Adapter by iButtonlink and the software OneWireViewer
by Analog Devices. Other hardware and software could be used if the same
outcome is achieved but we strongly recommend using
OneWireViewer from the software front as it is
completely free. In that spirit, below we offer a short
step by step tutorial on how to programm iButtons using this software
which we also present in a GIF below:
- Download OneWireViewer. An instructional video on how to get started can be found here. Note that the software is a Java-based applet, so Java will need to be installed before proceeding.
- Connect the adapter to the reader.
- Insert the iButton reader into an available USB-port. If the software is launched for the first time, a USB port will need to be selected. Choose a USB-port from the drop-down list if prompted.
- Insert an iButton into the reader. If the iButton is working it will appear as a device with a serial number in the software’s left window panel; if the iButton does not show up then it is likely unusable or malfunctioning.
- Select the iButton in the list of devices on the left, and go to the “Thermochron” tab.
- Click “Start new mission” to start programming the iButton.
- Check the box that says “Synchronize Real-time Clock”. This will make sure the iButton’s internal real-time clock is synchronized with the time on the PC that is being used for programming.
- Enter the “Sampling Rate”, in minutes.
- Enter “Mission Start Delay”, which will be the time before the first data sample will be collected. Note that this is in minutes; for example, for a 24h delay in recording the delay will need to be of 1440 minutes.
- Do not “Enable Rollover” unless you want your data to be overwritten once the memory is full.
- Click “OK”. The line reading “Is Mission Active?” should change from “False” to “True” within a second or two. It will also display “First sample not yet collected”.
- Insert the iButton inside the OTM ensuring that an air-tight, water-proof seal is achieved and the OTM is ready to be deployed in the field.
Step-by-step process on how to program an iButton using the OneWireViewer software
NOTE: It will be up to the user to figure out the math related to the sampling rate which will be dependent on the iButton’s storing capacity (i.e., the number of readings it can hold). Often, the need to record temperatures over a long period of time minimizes the number of observations within a given day. To that end, we recommend that, if multiple OTMs are to be deployed, that their “Mission Start Delay” is modified accordingly such that there is a certain degree of staggering in the measurements they record. Say that we are interested in recording daily thermal fluctuations for a period of multiple months such that the minimum sampling rate we can afford is 2h. In that case we would recommend splitting OTMs into two groups one with a “Mission Start Delay” of 1440 minutes and another with 1500 such that the eventual recordings are staggered by 60 minutes.
Deploying OTMs in the field
Once OTMs are programmed the next step is to deploy them in the
field. As a general rule we recommend deploying the maximum number of
OTMs possible within budget constraints. A greater number of OTMs will
enable the capture of a greater number of thermal microhabitats which
will be crucial in subsequent steps of the throne package.
In addition, we recommend informed as opposed to random
deployment throughout the area of study to minimize the degree
of overlap in the information provided by each logger. To achieve
informed deployment, we recommend the following:
- Become familiar with your area of study to identify general microhabitat types to target as well as daily temperature fluctuations. A key point here is identifying the general orientation of your study site which will determine the incidence of the sun.
- Deploy OTMs evenly across all microhabitats and surfaces with different orientations within your site.
- If possible, add replicates for each but if the number of possible replicates is limited, favor microhabitats that are more represented in your area of study.
Reading iButton data
The last step of the process will be to recover the OTMs from the
field and read the data collected by the iButtons. The reading process
is very similar to the programming with steps 2-4 above being the same.
Below we offer yet another small tutorial on how to fully read and
download this data which we also show as a GIF (Figure
4):
- Select the iButton in the software’s left window pane.
- Navigate to the “Thermocron” tab, then “Temperatures”.
- The reader will take a second to display in a graph of the temperatures plotted over time. Once the graph shows up, right-click anywhere within the graph window for a drop-down menu to appear.
- Select “Save Data to
.csvFile” and save the file in a directory within your computer. Keep track of this directory as its direction will be the input of subsequentRfunctions as part of thethroneRworkflow.
NOTE: The data will remain on the iButton until it is programmed anew. Once you start a new mission, the old mission data will be lost, so we strongly(( recommend to make sure all data has been correctly downloaded before re-deployment.
Step-by-step process on how to read data logged by an iButton using the OneWireViewer software
Note on links to commercial sites
Although we include links to multiple commercial sites throughout
this vignette, we do not have any financial interest in recommending any
particular product to users of throne. The devices and
software we list here is what worked for our purposes and what we know
how to us.
Next we will move on to the R workflow of the
throne package, starting with how to read and process
.tif files obtained via aerial photogrammetry.